This could be a very useful resource for those studying or teaching the American political and economic system - StateMaster offers state-level data from the Census Bureau, the FBI, and the National Center for Educational Statistics.
Graphs, maps, scatterplots, and bar charts galore.
Thanks to Michael Heise at Empirical Legal Studies for the tip.
4.28.2006
4.27.2006
LESTER
Learning Science and Technology Repository
"...an online community and database focused on innovations in learning science and technology (LST), profiles innovative research projects and researchers. Registered users can add, update, or modify records about their projects and organization, thereby keeping the information accurate and up-to-date. Registration is not required to search or browse the database."
4.21.2006
Digital resources
The Center for Studies in Higher Education recently released its long-awaited report "Use and Users of Digital Resources: A focus on undergraduate education in the humanities and social sciences."
According to the Executive Summary and Conclusion, there's more or less a consensus that e-pedagogy is not the cost or labor saver it's often proported to be, nor are technologies always a "good fit" for different pedagogical styles. We're clearly still in the very early stages of this trend, and have yet to really develop a technological pallet rich (and intuitive) enough that faculty are using it as a natural extension of their teaching styles.
Add to this the enormous diversity of interface designs and standards, and we're clearly some ways away from achieving ubiquity and the associated economies of scale.
Of course, this doesn't mean we should ignore what tech can do for teaching; it just means we need to recognize that this is a "frontier era," with all the trial and error birthing pains that implies. One practice that the authors and respondents strongly suggest is a movement towards standardization of user studies, and greater transparency of ongoing practices.
Interesting stuff. A recommended read, especially for those looking ahead to several decades in a classroom.
Field experiments
ICPSR and Yale's ISPS will be offering a workshop on Designing, Conducting, and Analyzing Field Experiments this July 19-21 in New Haven.
It's not cheap - $850 for ICPSR members - but hardship case waivers are available.
It's not cheap - $850 for ICPSR members - but hardship case waivers are available.
4.18.2006
Use it like you stole it
I wonder how long this site will sustain being double-listed by Digg and Lifehacker, but if you get the chance, check out the nice essay: Ten things every Microsoft Word user should know.
Think of it as MS Word for Not-so Dummies. GD covers: Styles, Line and Page Breaks, Captioning and References, Death to Auto-formatting, and more.
These are especially handy when writing longish manuscripts (e.g., dissertations) that must eventually fit (arbitrary) style guidelines (or they won't let you graduate).
I'm sorry - did that sound bitter?
4.13.2006
What we observe
My good friend Trista showed me this video when she was in town last week. I think I will use it for every methods class I ever teach.
The task:
There are two groups of people in the video, one passing a basketball from chest-to-chest, and the other using bounce passes.
The first time you watch the video (24 sec), try to count the number of chest passes. This will be difficult, as the players are constantly in motion, sometimes occluding other players.
Watch it a second time, this time trying to count the number of bounce passes.
Notice anything odd? Watch it again.
Senate voting patterns
In his blog Analytical Visions, Andrew Bond (who appears to be a mathematician by training) recently posted a network study of voting patterns in the Senate.
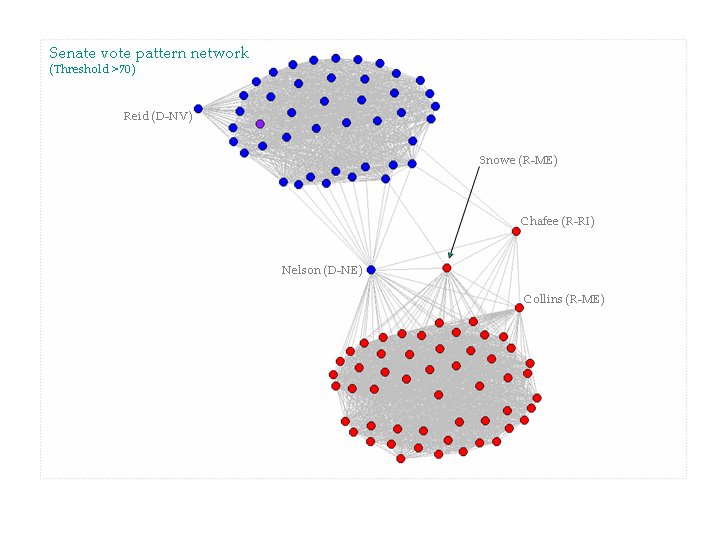 I'd like to see better documentation of exactly what Andrew was working with, and his various calculations, but the graphics are quite interesting (they might be compelling too, if we were told exactly what they represented).
Personal opinion: social network analysis will be the "new black" (i.e., methodologically "in") in five years. Any political scientist-in-training who wants to an edge in that market would do well to start learning this stuff now.
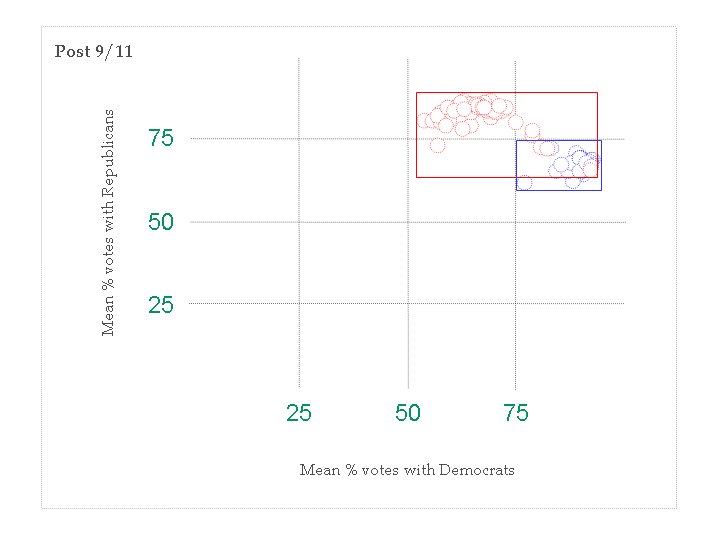
Addendum: Andrew has posted a sequel, this time with a bit more explanation on the techniques he's using. This one focuses on changes in Senate voting following 9-11-01. Conclusion? Democratic Senators shifted to the right. Perhaps not exactly counter-intuitive, but the analysis is clean and compelling.
I'd like to see better documentation of exactly what Andrew was working with, and his various calculations, but the graphics are quite interesting (they might be compelling too, if we were told exactly what they represented).Personal opinion: social network analysis will be the "new black" (i.e., methodologically "in") in five years. Any political scientist-in-training who wants to an edge in that market would do well to start learning this stuff now.
Addendum: Andrew has posted a sequel, this time with a bit more explanation on the techniques he's using. This one focuses on changes in Senate voting following 9-11-01. Conclusion? Democratic Senators shifted to the right. Perhaps not exactly counter-intuitive, but the analysis is clean and compelling.
Learn how to draw data
This went out over the POLMETH listserv awhile back (I've been on the road for the past three weeks):
 Arlington, Virginia, Monday, May 22, 2006
Presenting Data and Information
a one-day course taught by Edward Tufte
a one-day course taught by Edward Tufte
Arlington, Virginia, Monday, May 22, 2006Topics include: fundamental strategies of information design; statistical data: tables, graphics, and semi-graphics; complexity and clarity; effective presentations: on paper and in person; use of video, overheads, computers, and handouts; scientific visualizations; and design of computer interfaces and manuals.
$360 per person ($180 for registered students), includes Tufte's books: Visual Explanations, Envisioning Information, and The Visual Display of Quantitative Information, and the Napoleon's March poster ($139 value).
Groups of 10 or more may receive a 25% discount.
Permanent part-time coding
This announcement went out a couple of weeks ago, but may still be available:
The Project for Excellence in Journalism is looking for several people to code content for $15/hour (20-30 hours each week), plus benefits.
The Project for Excellence in Journalism is looking for several people to code content for $15/hour (20-30 hours each week), plus benefits.
PEJ is a research organization funded by the Pew Charitable Trusts and initiated by journalists in order to analyze media. PEJ will soon be formally aligning with the Pew Research Center and moving into their downtown Washington, DC offices.
Members of the coding team will conduct detailed analysis of content gathered from various news organizations. This involves systematic reading and interpretation of news articles. In addition, coders will enter data into a collective database, assist with the collection of news materials, and assist with the maintenance of PEJ’s media archive. Experience with content analysis and social science research is helpful, but not necessary. Training will be provided.
The job begins July, 2006. Interested candidates should send a resume, cover letter and references to:
Paul Hitlin
Project for Excellence in Journalism
1850 K St, NW #850
Washington, DC 20006
phitlin@journalism.org
F: 202-293-6946
4.07.2006
Book Reviews, UM Libraries
This is of purely local interest to University of Maryland students and faculty. I just stumbled across a useful guide for finding book reviews through the UM Libraries' online system. There are far more search tools available than I knew about. Makes we wonder what other IT research resources are available on campus that I'm missing...
4.06.2006
4.04.2006
Tracking K Street
OpenSecrets, a project of the Center for Responsive Politics, has made a database of Lobbying Spending available that you can search or browse by name, industry, issue or agency.
Since many of these lobbyists appear to work for multiple clients, this would seem to be the perfect dataset for network analysis.
Affiliation networks, anyone?
Since many of these lobbyists appear to work for multiple clients, this would seem to be the perfect dataset for network analysis.
Affiliation networks, anyone?
4.03.2006
First Monday, Part XI
Surprise! I'm actually on time this month. This issue of First Monday is now available.
Articles of interest include: Lee Shaker, on Information integrity in the Digital Age, and David Bills and Stephanie Holliman et al., on the Effective Use of Information and Communication Technology in Scholarship.
Articles of interest include: Lee Shaker, on Information integrity in the Digital Age, and David Bills and Stephanie Holliman et al., on the Effective Use of Information and Communication Technology in Scholarship.
WordHoard Project
The Northwestern University departments of English and Classics and NU-IT Academic Technologies has announced the completion of the Mellon Foundation-funded WordHoard Project.
The project applies to highly canonical literary texts the insights and techniques of corpus linguistics, that is to say, the empirical and computer-assisted study of large bodies of written texts or transcribed speech. In the WordHoard environment, such texts are annotated or tagged by morphological, lexical, prosodic, and narratological criteria. They are mediated through a 'digital page' or user interface that lets scholarly but non-technical users explore the greatly increased query potential of textual data kept in such a form.
Subscribe to:
Posts (Atom)