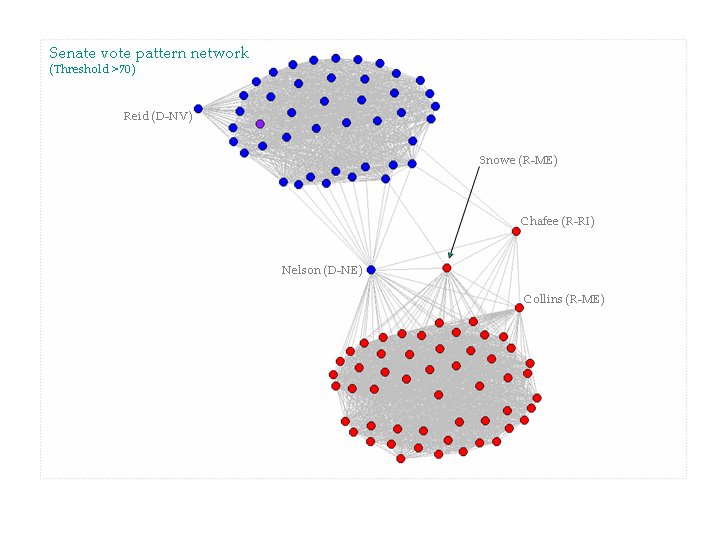
 I'd like to see better documentation of exactly what Andrew was working with, and his various calculations, but the graphics are quite interesting (they might be compelling too, if we were told exactly what they represented).
Personal opinion: social network analysis will be the "new black" (i.e., methodologically "in") in five years. Any political scientist-in-training who wants to an edge in that market would do well to start learning this stuff now.
Addendum: Andrew has posted a sequel, this time with a bit more explanation on the techniques he's using. This one focuses on changes in Senate voting following 9-11-01. Conclusion? Democratic Senators shifted to the right. Perhaps not exactly counter-intuitive, but the analysis is clean and compelling.

1 comment:
Thank you for linking to my analysis blog. I have added another post analyzing the US senate voting patterns for 2001 (pre and post 9/11). Also, on the post I try to explain what the networks mean (ie. how they were made and some basic conclusions).
Post a Comment