 Most have been around awhile (at least in Internet terms), but we might all benefit from browsing these sites, and thinking about how patterns in our data might be better represented.
Showing posts sorted by relevance for query visualization. Sort by date Show all posts
Showing posts sorted by relevance for query visualization. Sort by date Show all posts
8.31.2007
Data visualization
Earlier this month, Smashing Magazine posted Data Visualization: Modern Approaches, a fascinating overview of 30+ online graphical experiments.
Most have been around awhile (at least in Internet terms), but we might all benefit from browsing these sites, and thinking about how patterns in our data might be better represented.
Most have been around awhile (at least in Internet terms), but we might all benefit from browsing these sites, and thinking about how patterns in our data might be better represented.
3.07.2007
Many, many eyes
Remember NameVoyager, the baby name data visualization that was a rage last year? Well, its developer has another experiment: Many Eyes.
 While it lacks many of the annotation features of Sense.us, since its public release last month it has gotten substantial attention - to date, 1,336 datsets have been uploaded, with 1137 separate visualizations.
I'm certain we'll see more like this soon (e.g., Data360, Swivel). I also predict that as the designs become more sophisticated (ability to generate statistical and structural metrics would be nice), and gain traction as collaborative media, we'll also see editing and viewing controls emerge (ala Google Docs). Imagine what it might mean to the scientific process when datasets and access codes are published along with scientific articles.
It will certainly change peer review.
Addendum: I should note that both Sense.us and NameVoyager were built using Prefuse, billed as a "Java-based toolkit for building interactive information visualization applications."
While it lacks many of the annotation features of Sense.us, since its public release last month it has gotten substantial attention - to date, 1,336 datsets have been uploaded, with 1137 separate visualizations.I'm certain we'll see more like this soon (e.g., Data360, Swivel). I also predict that as the designs become more sophisticated (ability to generate statistical and structural metrics would be nice), and gain traction as collaborative media, we'll also see editing and viewing controls emerge (ala Google Docs). Imagine what it might mean to the scientific process when datasets and access codes are published along with scientific articles.
It will certainly change peer review.
Addendum: I should note that both Sense.us and NameVoyager were built using Prefuse, billed as a "Java-based toolkit for building interactive information visualization applications."

5.20.2010
Interesting links 5-20-10
"The goal of visualization is to aid our understanding of data by leveraging the human visual system's highly tuned ability to see patterns, spot trends, and identify outliers. Well-designed visual representations can replace cognitive calculations with simple perceptual inferences and improve comprehension, memory, and decision making. By making data more accessible and appealing, visual representations may also help engage more diverse audiences in exploration and analysis." |
"[The] advent of a truly "Open Science" which will profoundly affect the pace and character of subsequent theory and tool-driven paradigm shifts ... politicians and pundits point to the expectation that Science and Technology will let humanity invent its way out of the problems we've created." |
"Digitised material will include extensive coverage of local, regional and national press across three and a half centuries ... looking at key events and themes such as the Crimean War, the Boer War and the suffragette movement. The aim will be to build a 'critical mass' of material for researchers ... " |
Revolution R Enterprise is designed for corporations, government agencies and academic researchers that require the highest levels of performance, reliability and computational power for their large-scale data analysis. It is optimized to run the fastest computations of any R software on a wide-range of platforms - features a visual development environment (i.e., no more command-line). RR Enterprise is FREE for academic researchers. |
"How do you move from a culture of "need to know" to a culture of "need to share?" Richard Boly thinks about the answer to that question every day. Boly, a speaker at next week's Gov 2.0 Expo, is the director of the Office of eDiplomacy at the State Department. His office is an applied technology think tank within the agency that's focused on improving the agency's communication and knowledge sharing. "Boly is responsible for overseeing Virtual Presence Posts (VPPs), enterprise search, classified web publishing, and social networking, including the development of StateBook." |
3.22.2007
Another text visualization
Jeff Clark (Neoformix) experiments with ways to highlight "key" features in text. His latest text visualization tool is a variant on his recent word frequency/co- occurrence maps, with the addition of Sparklines and a new dynamic interface.
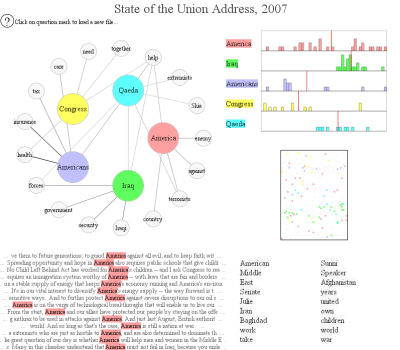 I don't know how to use this for analysis, but it's interesting.
5.12.2007
Intercoder agreement
There's been a lot written about the relative merits of folksonomies vs controlled vocabularies (i.e., tagging), but few frame it in terms of intercoder agreement (measures by which content analysts assess coding reliability).
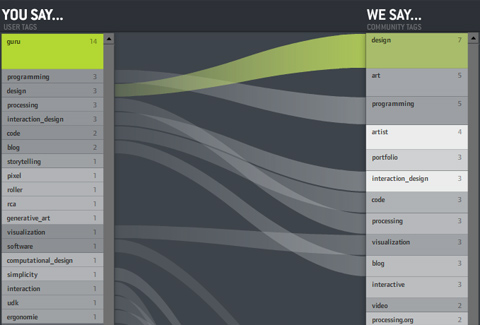 Recently, Moritz Stefaner at Well-formed Data posted a visualization to compare tagging practices, which could be a useful tool to draw researchers' attention to discrepancies across multiple coders.
A few annotation (aka "code-and-retrieve") packages currently come with embedded intercoder agreement tools. Fewer make much use of visualization tools, generally. My advice to developers is to seriously integrate both functions into the design of next generation CAQDAS software.
Recently, Moritz Stefaner at Well-formed Data posted a visualization to compare tagging practices, which could be a useful tool to draw researchers' attention to discrepancies across multiple coders.A few annotation (aka "code-and-retrieve") packages currently come with embedded intercoder agreement tools. Fewer make much use of visualization tools, generally. My advice to developers is to seriously integrate both functions into the design of next generation CAQDAS software.
6.06.2006
Humanities visualisation
Okay, so the humanities aren't social science - but there are a lot of parallels in the forms of data used by scholars in both fields. This Thursday (June 8th) at 10:30am, Stan Ruecker (U Alberta) will be giving an overview of his research at the Maryland Institute for Technology in the Humanities here in College Park.
Ruecker is a member of the Nora Text Mining and Visualization project, and an expert in interface and visualization design for the humanities.
Open to the public and held in the basement level of McKeldin library.
Ruecker is a member of the Nora Text Mining and Visualization project, and an expert in interface and visualization design for the humanities.
Open to the public and held in the basement level of McKeldin library.
1.17.2006
Visualizing information
I'm still a week or so away from finishing the diss, but I ran across something that really impressed me, and thought I'd pass it along. Also, I just completed my introductory chapter, and may be feeling a bit cocky.
Anyway.
The Department of Energy's Pacific Northwest National Laboratory has an Information Visualization project that is truly fascinating. The problem is that for many, many fields there is now more digital information available than a single human can meaningfully process. Visually representing patterns found in text, images, and audio filters out "insignificant" variation, allowing us to deal with greater data volumes.
I recommend checking out their published papers.
Well, back to it. See you in a couple weeks.
Tags: text mining, visualization
Anyway.
The Department of Energy's Pacific Northwest National Laboratory has an Information Visualization project that is truly fascinating. The problem is that for many, many fields there is now more digital information available than a single human can meaningfully process. Visually representing patterns found in text, images, and audio filters out "insignificant" variation, allowing us to deal with greater data volumes.
I recommend checking out their published papers.
Well, back to it. See you in a couple weeks.
Tags: text mining, visualization
3.05.2007
Sense.us
Prepare to be blown away. Jeffrey Heer et al., have a new web-based ap to support asynchronous collaborative information visualization.
 According to the site, it supports "view sharing, discussion, graphical annotation, and social navigation and includes novel interaction elements." That may sound dull, but watch the Flash movie (a paper is also available).
Sense.us is amazing. Imagine how it could be used not only for collaborative research, but also as a way to prep data for lectures, or support in-class exploration by students.
Thanks to Mike Love at SmartMobs for the link.
According to the site, it supports "view sharing, discussion, graphical annotation, and social navigation and includes novel interaction elements." That may sound dull, but watch the Flash movie (a paper is also available).Sense.us is amazing. Imagine how it could be used not only for collaborative research, but also as a way to prep data for lectures, or support in-class exploration by students.
Thanks to Mike Love at SmartMobs for the link.
5.26.2010
Interesting links: 05.26.10
Re-Imagining Learning in the 21st Century
“On May 17 … educators, parents and policy experts gathered at The New School in NYC ... to offer visions for the future of education and share promising moments ... to increase the relevancy of learning by meeting kids where their interests are and helping them identify, discover, trace and follow that interest”
Ethnicity and Geography of Facebook Users
“On May 17 … educators, parents and policy experts gathered at The New School in NYC ... to offer visions for the future of education and share promising moments ... to increase the relevancy of learning by meeting kids where their interests are and helping them identify, discover, trace and follow that interest”
Ethnicity and Geography of Facebook Users
“ePluribus: Ethnicity on Social Networks, by the Facebook data science team includes some interesting estimates of the geographic distributions of Facebook users.”
Legislation Before Congress to Make CRS Reports Public
Legislation Before Congress to Make CRS Reports Public
“The Legislation: S. Res. 118 and H.R. 3762. As of today, both bills are listed as “referred to committee.” The House bill appears stalled since nothing has happened with it since October, 2009. ”
Consumer Genetic Tests Under Scrutiny
Consumer Genetic Tests Under Scrutiny
"On May 19, the House Committee on Energy and Commerce sent a toughly worded letter to three CEOs, including Pathway Genomics, [who] was preparing to sell an over-the-counter genetic-testing kit ... called Genetic Health Report, purported to test for more than 70 health issues, including predispositions to Alzheimer's, breast cancer, and diabetes."
ITU calls for broadband access for half the world by 2015
ITU calls for broadband access for half the world by 2015
“The number of Internet users has more than doubled since 2003 … and today more than 25 per cent of the world’s population is using the Internet … more efforts are needed to increase the number of Internet users. While today 75 per cent of all households have a TV, only 25 per cent have Internet access. In the developing countries, home Internet penetration is as low as 12 per cent.”
Physical Visualization of Urban Social Data
Physical Visualization of Urban Social Data
“Social Bits is a research design project focused on putting digital information in a physical context. A collection of small interventions located at Istanbul aim to explore the physical display of urban data. … Urban Mood visualizes the real-time mood of the citizens of İstanbul through a simple keyword projection and sound installation. Urbansphere Wearables is a collection of beautiful T-shirts that reflect the daily keywords of the city by using the data streams of social networks.”
4.03.2007
Cyberinfrastructure
For background on the previous CFP, check out the NSF's "Cyberinfrastructure Vision for 21st Century Discovery."
From the Executive Summary:
From the Executive Summary:
"Data, Data Analysis, and Visualization are vital for progress in the increasingly data-intensive realm of science and engineering research and education. Any cogent plan ... must address the phenomenal growth of data in all its various dimensions. Scientists and engineers are producing, accessing, analyzing, integrating, storing and retrieving massive amounts of data daily ... a trend that is expected to see significant growth in the very near future as advances ... automated data acquisition ... and other methods and technologies materialize. The anticipated growth in both the production and repurposing of digital data raises complex issues not only of scale and heterogeneity, but also of stewardship, curation and long-term access."'nuf said.
3.05.2007
Sweet Tools
Michael K Bergman has put together a very impressive list (420 entries) of Web 2.0 aps. Covering functionality from annotation to language processing to visualization and more, nearly 90 percent are FREE and open source.
5.30.2010
NodeXL: SNA for Excel
NodeXL is an Excel template that supports network visualization. It's about time (why hasn't MS already made SNA a central feature?).

Anyway, the template offers full network/graph customization, dynamic filtering, ability to calculate basic network metrics, as well as the ability to directly import networks from email and popular social network sites.
4.07.2007
Playing with data
The Parsons Institute for Information Mapping (New School) has put together a nice visualization that shows Electoral College results going back to 1789 in terms of the familiar "red state, blue state" maps.
 The color-coding is sometimes a bit odd (Dems, Federalists and Whigs are all blue), but quite fascinating. I had no idea that both candidates in 1820 were Republican. The interface includes issue polling, though I don't know how to interpret the results. Overall, very interesting, likely useful for classrooms.
H/T to Statistical Modeling, Causal Inference, and Social Science for the link.
The color-coding is sometimes a bit odd (Dems, Federalists and Whigs are all blue), but quite fascinating. I had no idea that both candidates in 1820 were Republican. The interface includes issue polling, though I don't know how to interpret the results. Overall, very interesting, likely useful for classrooms.H/T to Statistical Modeling, Causal Inference, and Social Science for the link.
2.17.2007
Experimenting with words
Jeff Clark has an interesting post at Neoformix on graphing word frequencies. Though the technique is admittedly a first start, it does offer a fairly good gestalt of overall content.
 The process:
Addendum: Actually, the entire process is easily replicated; most steps can be partly automated using "Search and Replace" and COUNTIF functions in MS Word and Excel, respectively. After isolating high-freq words, bold them in the original document and visually scan for adjacency, deleting "extraneous" (i.e., low-freq and non-adjacent) terms. I found the graphics were easier in UCInet, an inexpensive SNA tool that is both appropriate for smaller networks and easier to use.
In discussing this with a colleague, we noted that it might be useful to define "adjacency" differently (e.g., sentence or paragraph). This would be easy to accomplish with visual scans, though clearly has scaling limits. However, if you convert the original document such that "adjacency units" become separate rows, it is possible to combine Excel's COUNTIF and SEARCH functions to produce word frequencies. If the first column is the original text, you can count up to 255 separate strings across the others. A bit of creativity, and you can automatically identify specific pairings.
While the network graphics are interesting, I suspect it would be more useful to compare measures such as centrality and geodesic distance between specific terms across multiple documents.
The process:- Convert text into a stream of words
- Throw away 'stop words' [aka "function words"] (e.g., a, the, and, of, by)
- Count the frequency of remaining words
- Draw ovals for each word, scaled to reflect its frequency
- Connect words appearing consecutively in the text (not counting 'stop words')
- Discard ovals of words appearing fewer than 9 times
- Position ovals with a spring-embedded algorithm
Addendum: Actually, the entire process is easily replicated; most steps can be partly automated using "Search and Replace" and COUNTIF functions in MS Word and Excel, respectively. After isolating high-freq words, bold them in the original document and visually scan for adjacency, deleting "extraneous" (i.e., low-freq and non-adjacent) terms. I found the graphics were easier in UCInet, an inexpensive SNA tool that is both appropriate for smaller networks and easier to use.
In discussing this with a colleague, we noted that it might be useful to define "adjacency" differently (e.g., sentence or paragraph). This would be easy to accomplish with visual scans, though clearly has scaling limits. However, if you convert the original document such that "adjacency units" become separate rows, it is possible to combine Excel's COUNTIF and SEARCH functions to produce word frequencies. If the first column is the original text, you can count up to 255 separate strings across the others. A bit of creativity, and you can automatically identify specific pairings.
While the network graphics are interesting, I suspect it would be more useful to compare measures such as centrality and geodesic distance between specific terms across multiple documents.
1.10.2007
Visualizations
Far cheaper than a Tufte book, and possibly more interesting (certainly more entertaining), the Periodic Table of Visualization Methods has been making the rounds over the past several days.
While there's quite a lot of overlap (exactly how is an "evocative knowledge map" different from a "concept map"?), this is also a brilliant reminder of the myriad ways we have for communicating our ideas.
Now, if it were only available in book form...
While there's quite a lot of overlap (exactly how is an "evocative knowledge map" different from a "concept map"?), this is also a brilliant reminder of the myriad ways we have for communicating our ideas.
Now, if it were only available in book form...
1.04.2007
Blogosphere topos
Matthew Hurst (Nielsen BuzzMetrics) publishes a fascinating blog: Data Mining: Text Mining, Visualization and Social Media.
If you're wondering what this has to do with politics, check out his latest effort to map the "blogosphere", centered on DailyKos (others can be found here).
Those interested in seeing an in-depth (analytical) write-up on this might consider attending the upcoming International Conference on Weblogs and Social Media (Mar 26-28 in Boulder, CO).
If you're wondering what this has to do with politics, check out his latest effort to map the "blogosphere", centered on DailyKos (others can be found here).
Those interested in seeing an in-depth (analytical) write-up on this might consider attending the upcoming International Conference on Weblogs and Social Media (Mar 26-28 in Boulder, CO).
10.05.2006
DHS data mining techniques
No, really. The Dept of Homeland Security's Inspector General's Office recently published its Survey of DHS Data Mining Techniques.
They identified 12 datamining "systems and capabilities" within DHS, 9 of which are currently operational. These include "Expert Systems," "Association Processes," "Threat and Risk Assement Tools," "Collaboration and Visualization Processes," and "Advanced Analytics."
Sounds like they're not exactly sure what they mean by data mining.
They identified 12 datamining "systems and capabilities" within DHS, 9 of which are currently operational. These include "Expert Systems," "Association Processes," "Threat and Risk Assement Tools," "Collaboration and Visualization Processes," and "Advanced Analytics."
Sounds like they're not exactly sure what they mean by data mining.
7.17.2006
Studying online networks
Seems some folks down at ANU (Canberra) have been pushing the envelope for social scientific study of online mobilization. In 2005, they established a Virtual Observatory for the Study of Online Networks (VOSON), which uses web-crawlers, text mining, network analytics, and data visualization to study activist and party networks on several salient issues (e.g., environment, reproductive freedom, migration).
 Check out their publications for more details. Note that they've included several pdf Presentation files, to help you get a quick take on their methods.
3.17.2006
The web of life
The artist Francisco Devante Mibigatti has made a fascinating (and informative) network representation of discretionary spending, which he calls Death and Taxes.
 This quite different than Marc Lombardi's work, but still makes compelling use of network visualization to communicate otherwise overly complex material.
Fascinating, beautiful, informative.
This quite different than Marc Lombardi's work, but still makes compelling use of network visualization to communicate otherwise overly complex material.
Fascinating, beautiful, informative.
11.18.2005
Knowledge Navigator
Fascinating. Jeremy Douglas (Writer Response Theory) has just put up a fascinating post on the Legal Machines Project. In it, he references an Apple video from the 1980s, Knowledge Navigator. It's very low res, but I guarantee it will provide plenty of food for thought.
 Anyone know any more details about this project? Who was working on it then, and where are they now?
Tags: visualization, teaching
 Anyone know any more details about this project? Who was working on it then, and where are they now?
Tags: visualization, teaching
Subscribe to:
Posts (Atom)